
After 25 years of embedded systems development, I’ve spent countless hours tracking down bugs that manifested as mysterious lockups, intermittent crashes, or hardware that simply refused to cooperate. The techniques below represent the debugging toolkit I’ve refined across dozens of projects. These are some of the debugging methods that consistently get products to market faster and more reliably.
UART and printf: Still the Workhorse
Universally Available (When You Can Access It)
Nearly every microcontroller includes at least one UART, which makes serial debugging the default go-to method. Even when the pins aren’t exposed on production hardware, early prototypes and evaluation boards almost always provide a way to attach a USB-serial adapter.
printf-style debugging is simple and effective, but it comes with a cost: it’s typically heavy and slow. Formatting strings and transmitting them over UART can noticeably affect timing, especially inside interrupts or tight loops. Engineers should treat serial output as both a valuable tool and a potential source of side effects.
What You Can Accomplish With It
Despite its overhead, UART logging remains a powerful and flexible technique. Printing state transitions, variable values, timestamps, or error codes often provides enough visibility to diagnose most software-level issues. It’s also a dependable option during early bring-up, when more advanced debugging tools may not be functional yet.
LEDs as Real-Time Indicators
Never underestimate the humble LED for quick visual status. A blinking LED can reveal whether a system is alive, stuck, or repeatedly resetting with no console required.
Using multiple blink rates (slow, normal, fast) allows you to convey meaningful status without extra hardware.
GPIO Lines for Status and Timing
Disposable Pins With Big Value
A few dedicated GPIOs for debugging are standard in many embedded toolkits. Toggling a pin at key points in the code provides extremely high-resolution insight into timing, interrupts, race conditions, or hard-to-reproduce events.
Observe With Scope or Logic Analyzer
Even a low-cost oscilloscope or logic analyzer reveals:
- ISR latency
- Execution order
- Task switching behavior
- Timing jitter
- Missed or extra events
- Sections of code taking longer than expected
This level of visibility is difficult to achieve from software logging alone.
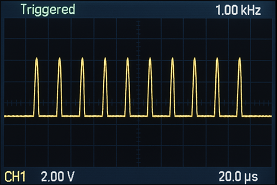
Pulse-Based Status Codes
When GPIO is limited or timing is critical, pulse patterns can deliver debug information. For example, three pulses might indicate a specific error, where five pulses might show a specific task started or branch was taken.
A simple helper function makes this easy to use:
void debugPulse(int count)
{
    for (int i = 0; i < count; i++) {
        GPIO_SET(DEBUG_PIN);
        delay_us(1);
        GPIO_CLEAR(DEBUG_PIN);
        delay_us(1);
    }
}
A logic analyzer or oscilloscope will reliably decode these pulses even when nothing else works.
Using an Unused DAC for Debug Output
If your microcontroller includes a digital-to-analog converter and it isn’t being used, it can become a surprisingly powerful debug channel.
Outputting different voltages to represent internal states or error codes gives you:
- Insight into slowly changing values
- A way to “watch” internal variables in real time
- States in a State Machine
- The ability to vary the trigger location on an oscilloscope
This method pairs well with a multimeter or oscilloscope, especially when debugging control loops or sensor-processing pipelines.
Traditional Debuggers
Breakpoints, Stepping, and Introspection
Hardware debuggers provide detailed insight into program flow:
- Pausing execution at breakpoints
- Stepping through instructions
- Watching variable values change
- Inspecting peripheral registers
- Monitoring memory in real time
These capabilities make debuggers essential once the firmware is stable enough for deeper inspection.
Expanded Capabilities
Modern IDEs and probes include:
- Watchpoints that trigger on memory access
- Tracing for instruction execution
- Runtime statistics for RTOS-based systems
- Access to internal hardware registers
These tools help you diagnose misconfigurations, timing issues, or rare bugs that don’t appear consistently.
Asserts: Catching the Impossible
Detecting “This Should Never Happen”
Asserts are essential for flagging unexpected states or logic violations. When an assert fires, it often indicates deep issues such as:
- Buffer overruns
- Stack overflows
- Corrupted data structures
- Race conditions
- Invalid state transitions
Making Asserts Useful
A good assert doesn’t just halt execution but should also indicate where it tripped and why. The resulting stack trace and breadcrumb trail should lead directly to the underlying issue.
Debug Structures in Firmware
Centralized Runtime Information
A dedicated debug structure lets you capture and observe internal state in a consistent, organized way. Engineers can examine the entire structure through a debugger, without cluttering the entire codebase with temporary variables.
Debuggers also allow the structure’s memory region to be downloaded for offline analysis. This enables deeper investigation using custom scripts, spreadsheets, or specialized analysis tools.
Example Debug Structure
typedef struct {
    uint32_t lastError;        // Most recent error code
    uint32_t eventCount;       // Events or transitions seen
    uint32_t isrTime_us;       // Measured ISR execution time
    uint32_t flags;            // Bitfield of active states
    uint32_t internalState;    // High-level system state
    uint32_t forceAction1;     // Used for test injections
    uint32_t forceAction2;     // Used for test injections
} debug_t;

extern debug_t gDebug;         // Global debug instance
Force-Action Fields
Force-action flags allow engineers to set specific values to trigger internal behavior deliberately. This is extremely effective when testing:
- Error-handling paths
- Recovery mechanisms
- Rare boundary conditions
- Watchdog scenarios
Rather than waiting for a rare condition to occur, the firmware can be nudged into it on demand.
Choosing the Right Technique
No single debugging method fits every system. The most productive approach is combining multiple low-overhead tools:
- LEDs or GPIO pulses for early-stage or catastrophic failures
- UART logging for general runtime information
- Debuggers for deep inspection
- DACs or debug structures for complex state tracking
Using a layered strategy reduces time-to-root-cause and increases confidence in the final firmware.
Conclusion
Effective embedded debugging requires the right technique at the right time. While advanced tools have their place, the time-tested basics (UARTs, LEDs, GPIOs, and asserts) solve the majority of real-world problems. These embedded debugging techniques, applied consistently from prototype through production, dramatically reduce time-to-root-cause and improve long-term maintainability. Whether you need help diagnosing mysterious failures or establishing debugging best practices for your team, these battle-tested methods form the foundation of reliable embedded systems development.